You run the event.
We prove the count.
Every entrance on one live number, ticketing by Spotlight beside it, and a verified attendance report for the brand by morning.
Your mail app should be opening. If nothing happened, it is not set up on this device — use one of these instead.
hello@clicrapp.com
Ticketing by Spotlight
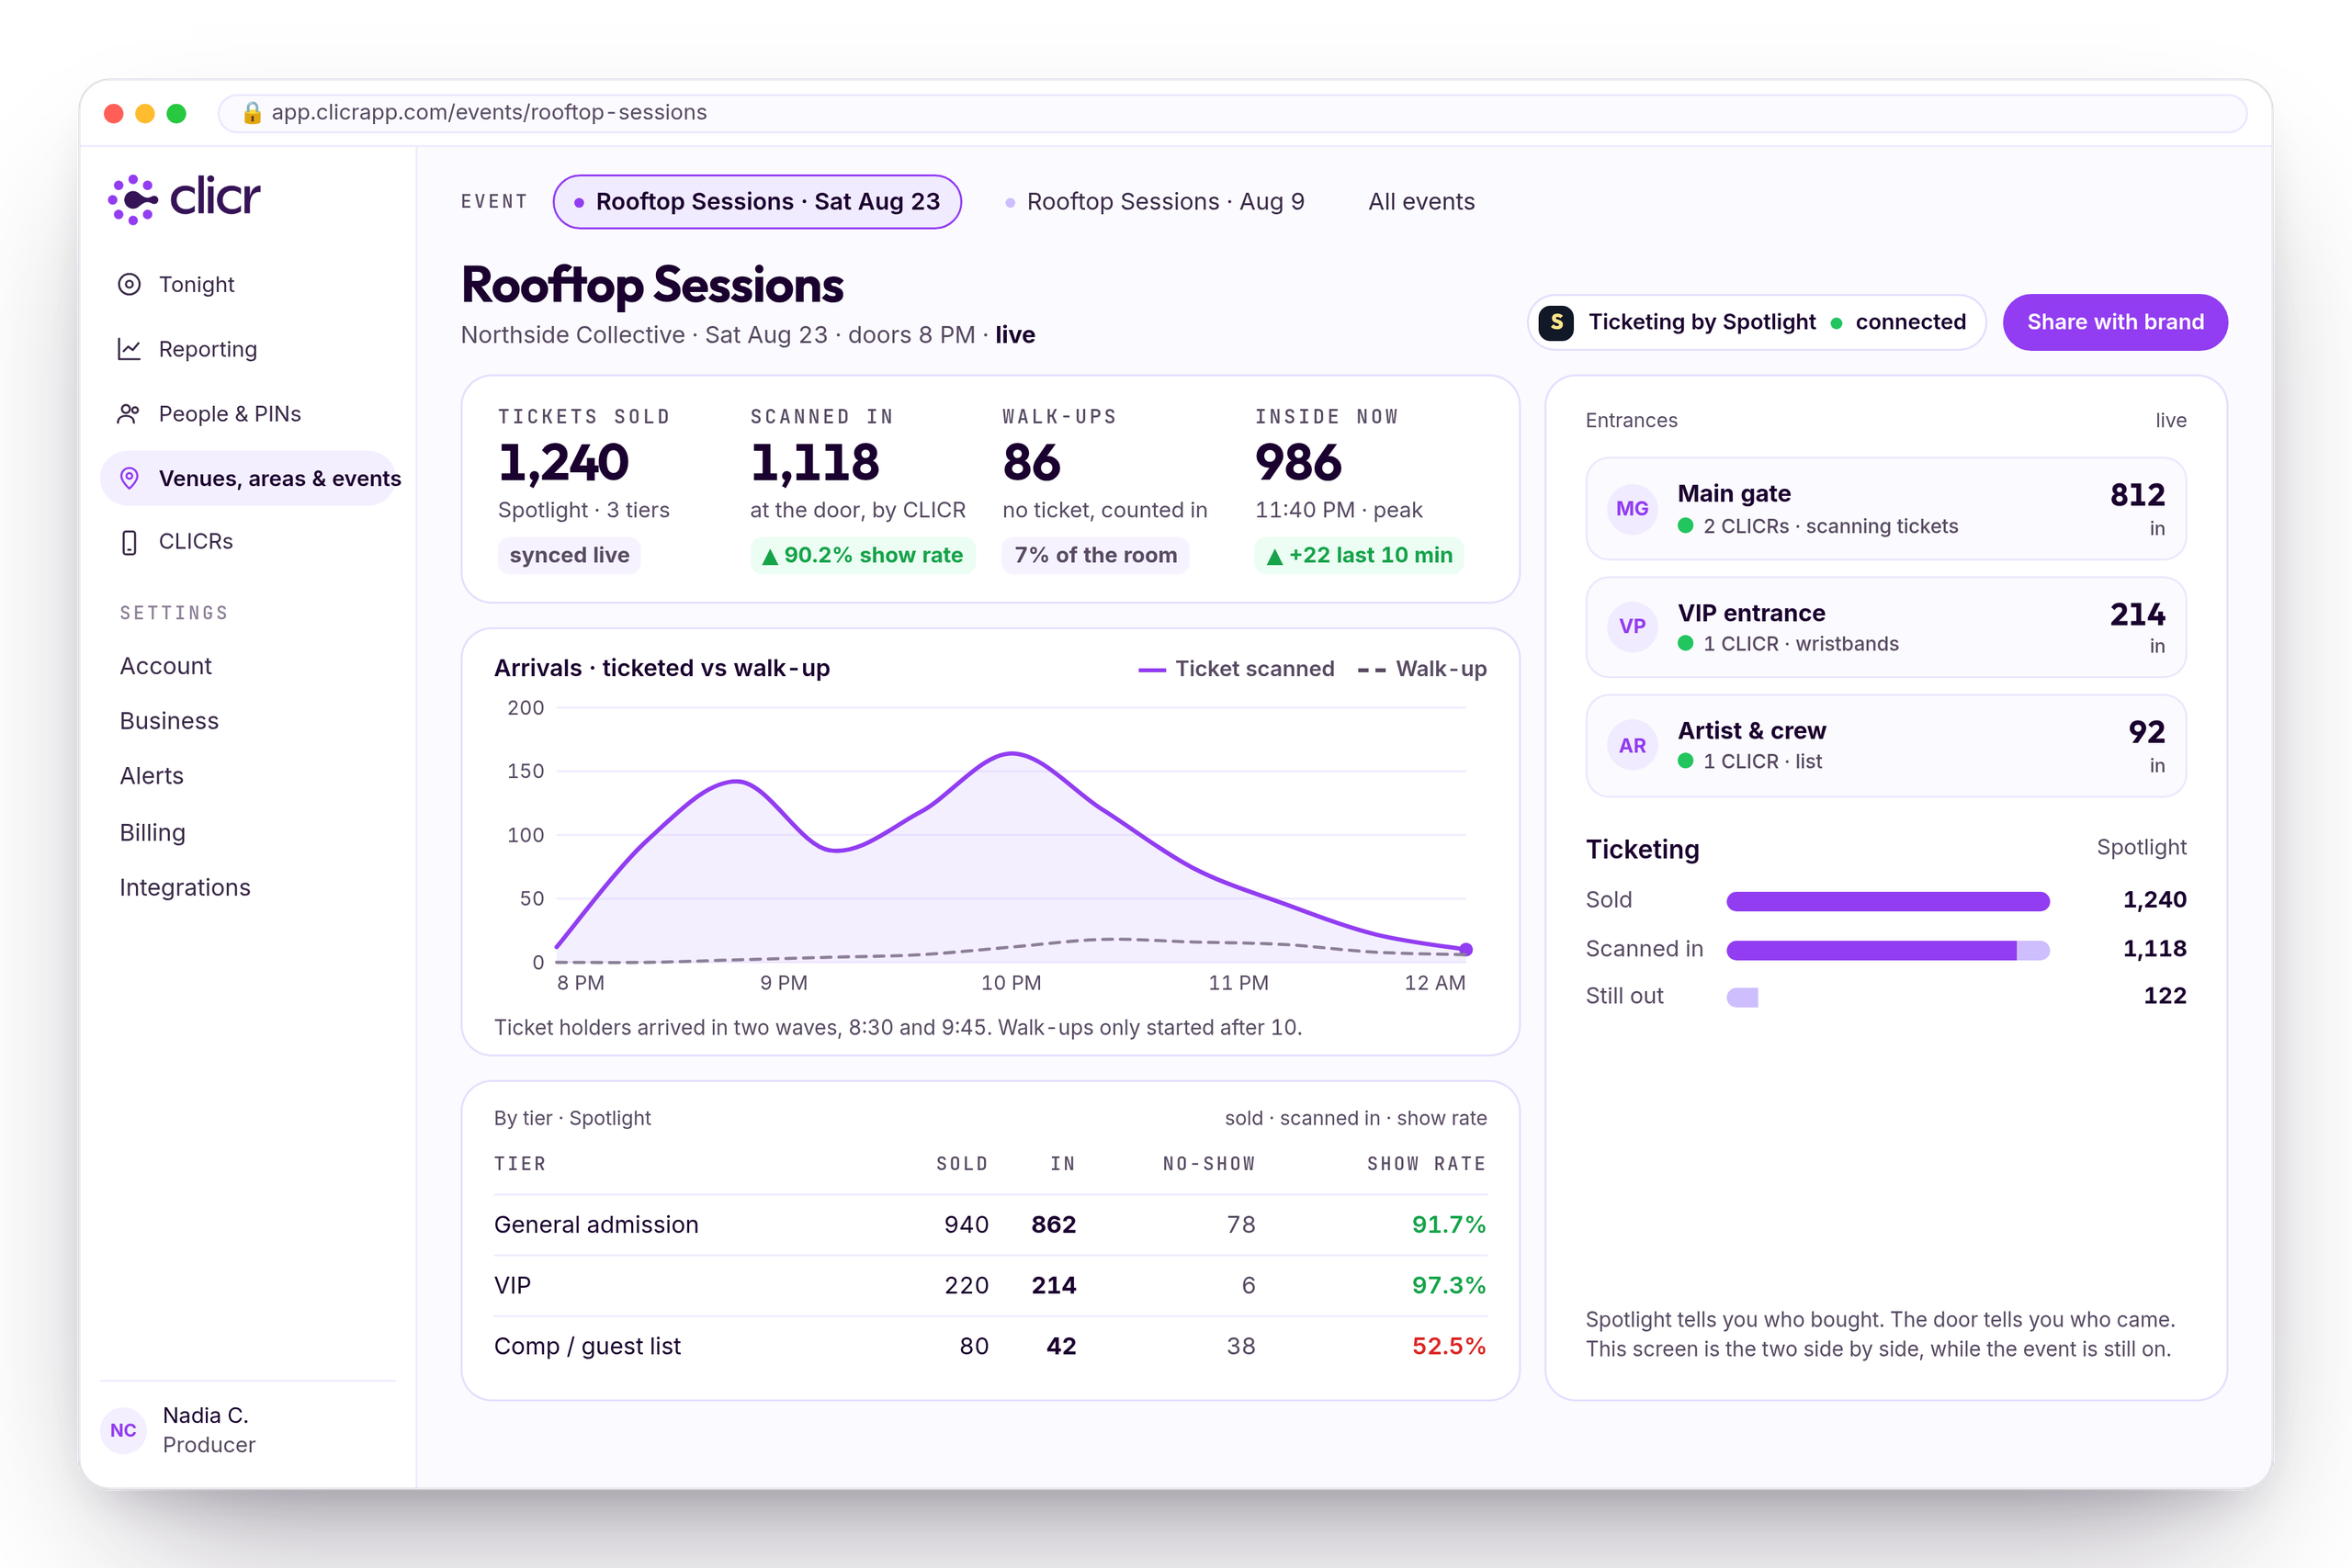
Sell the tickets on Spotlight and they show up here, tier by tier, synced live. CLICR has ticketing built in.
Show rate, live
1,240 sold, 1,118 scanned in, 90.2%. Not a guess at the end of the night, a number during it.
Walk-ups and comps
No ticket, still counted. Comps are where the no-shows hide, and the brand wants to know both.
You’re asked how many came.
You’re guessing.
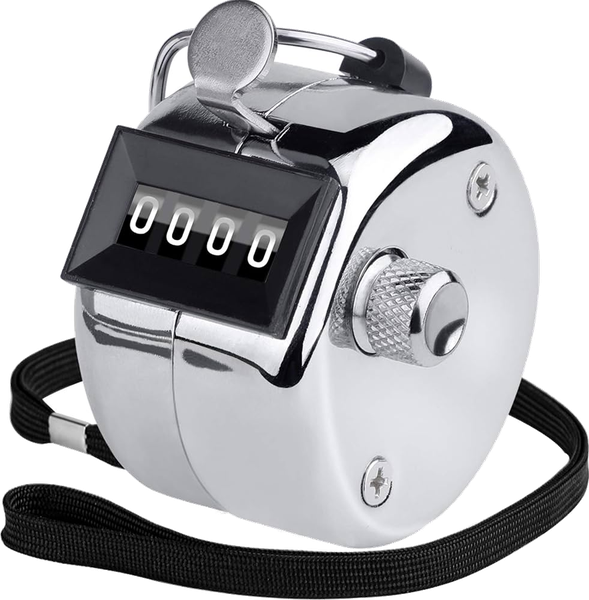
An analog tally counter at every entrance, a radio, a rough guess. Then the client wants the number and you’re doing math from memory or notes.
Prove attendance
Verified headcount the brand can trust.
Keep the line moving
Count at speed, no bottleneck at peak.
Every gate, one number
All entrances synced, live.
Live in 6 minutes
Set up for a one-night activation.
One number for
the whole site.
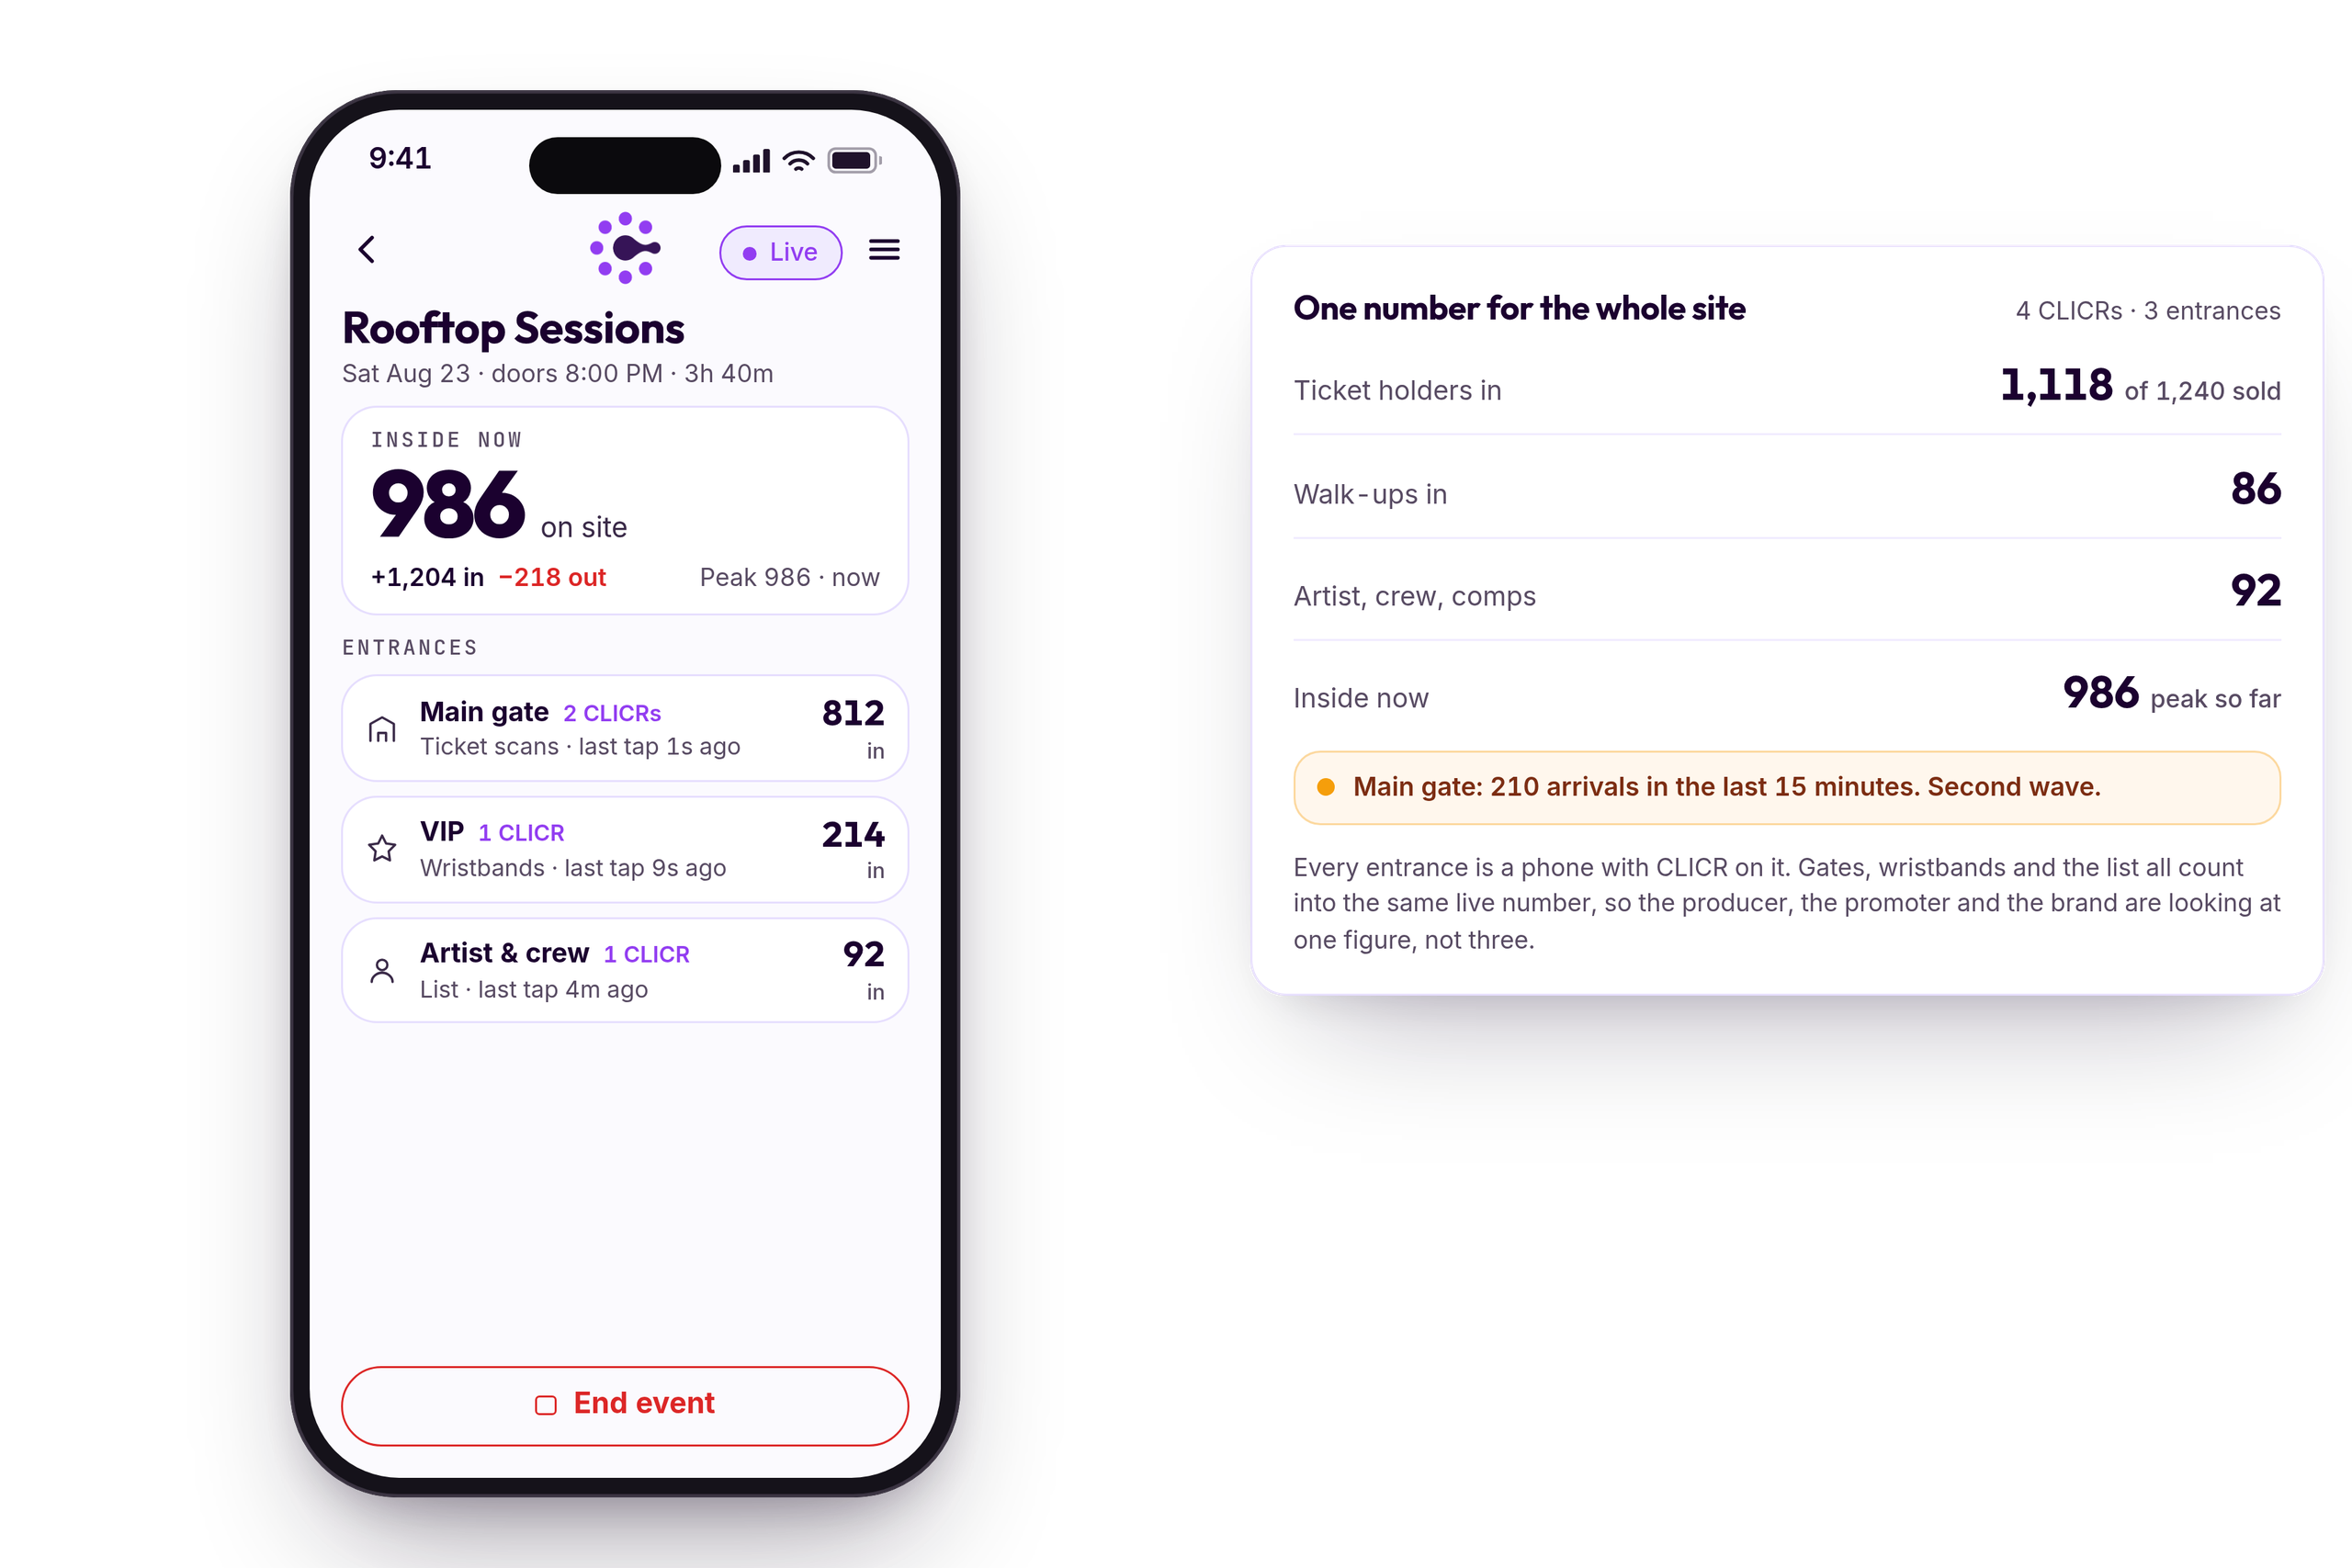
Main gate, VIP, artist and crew: each entrance is a phone with CLICR on it. Ticket scans, wristbands and the list all count into the same live figure, so the producer, the promoter and the brand are looking at one number, not three.
Any entrance
Add a gate in a minute and staff it with a phone. Wristbands and lists count the same way.
The second wave
210 arrivals in fifteen minutes shows on the producer's phone before the gate feels it.
Peak on site
The number the sponsor asks for, live, with the time it happened.
In the inbox
before load-out.
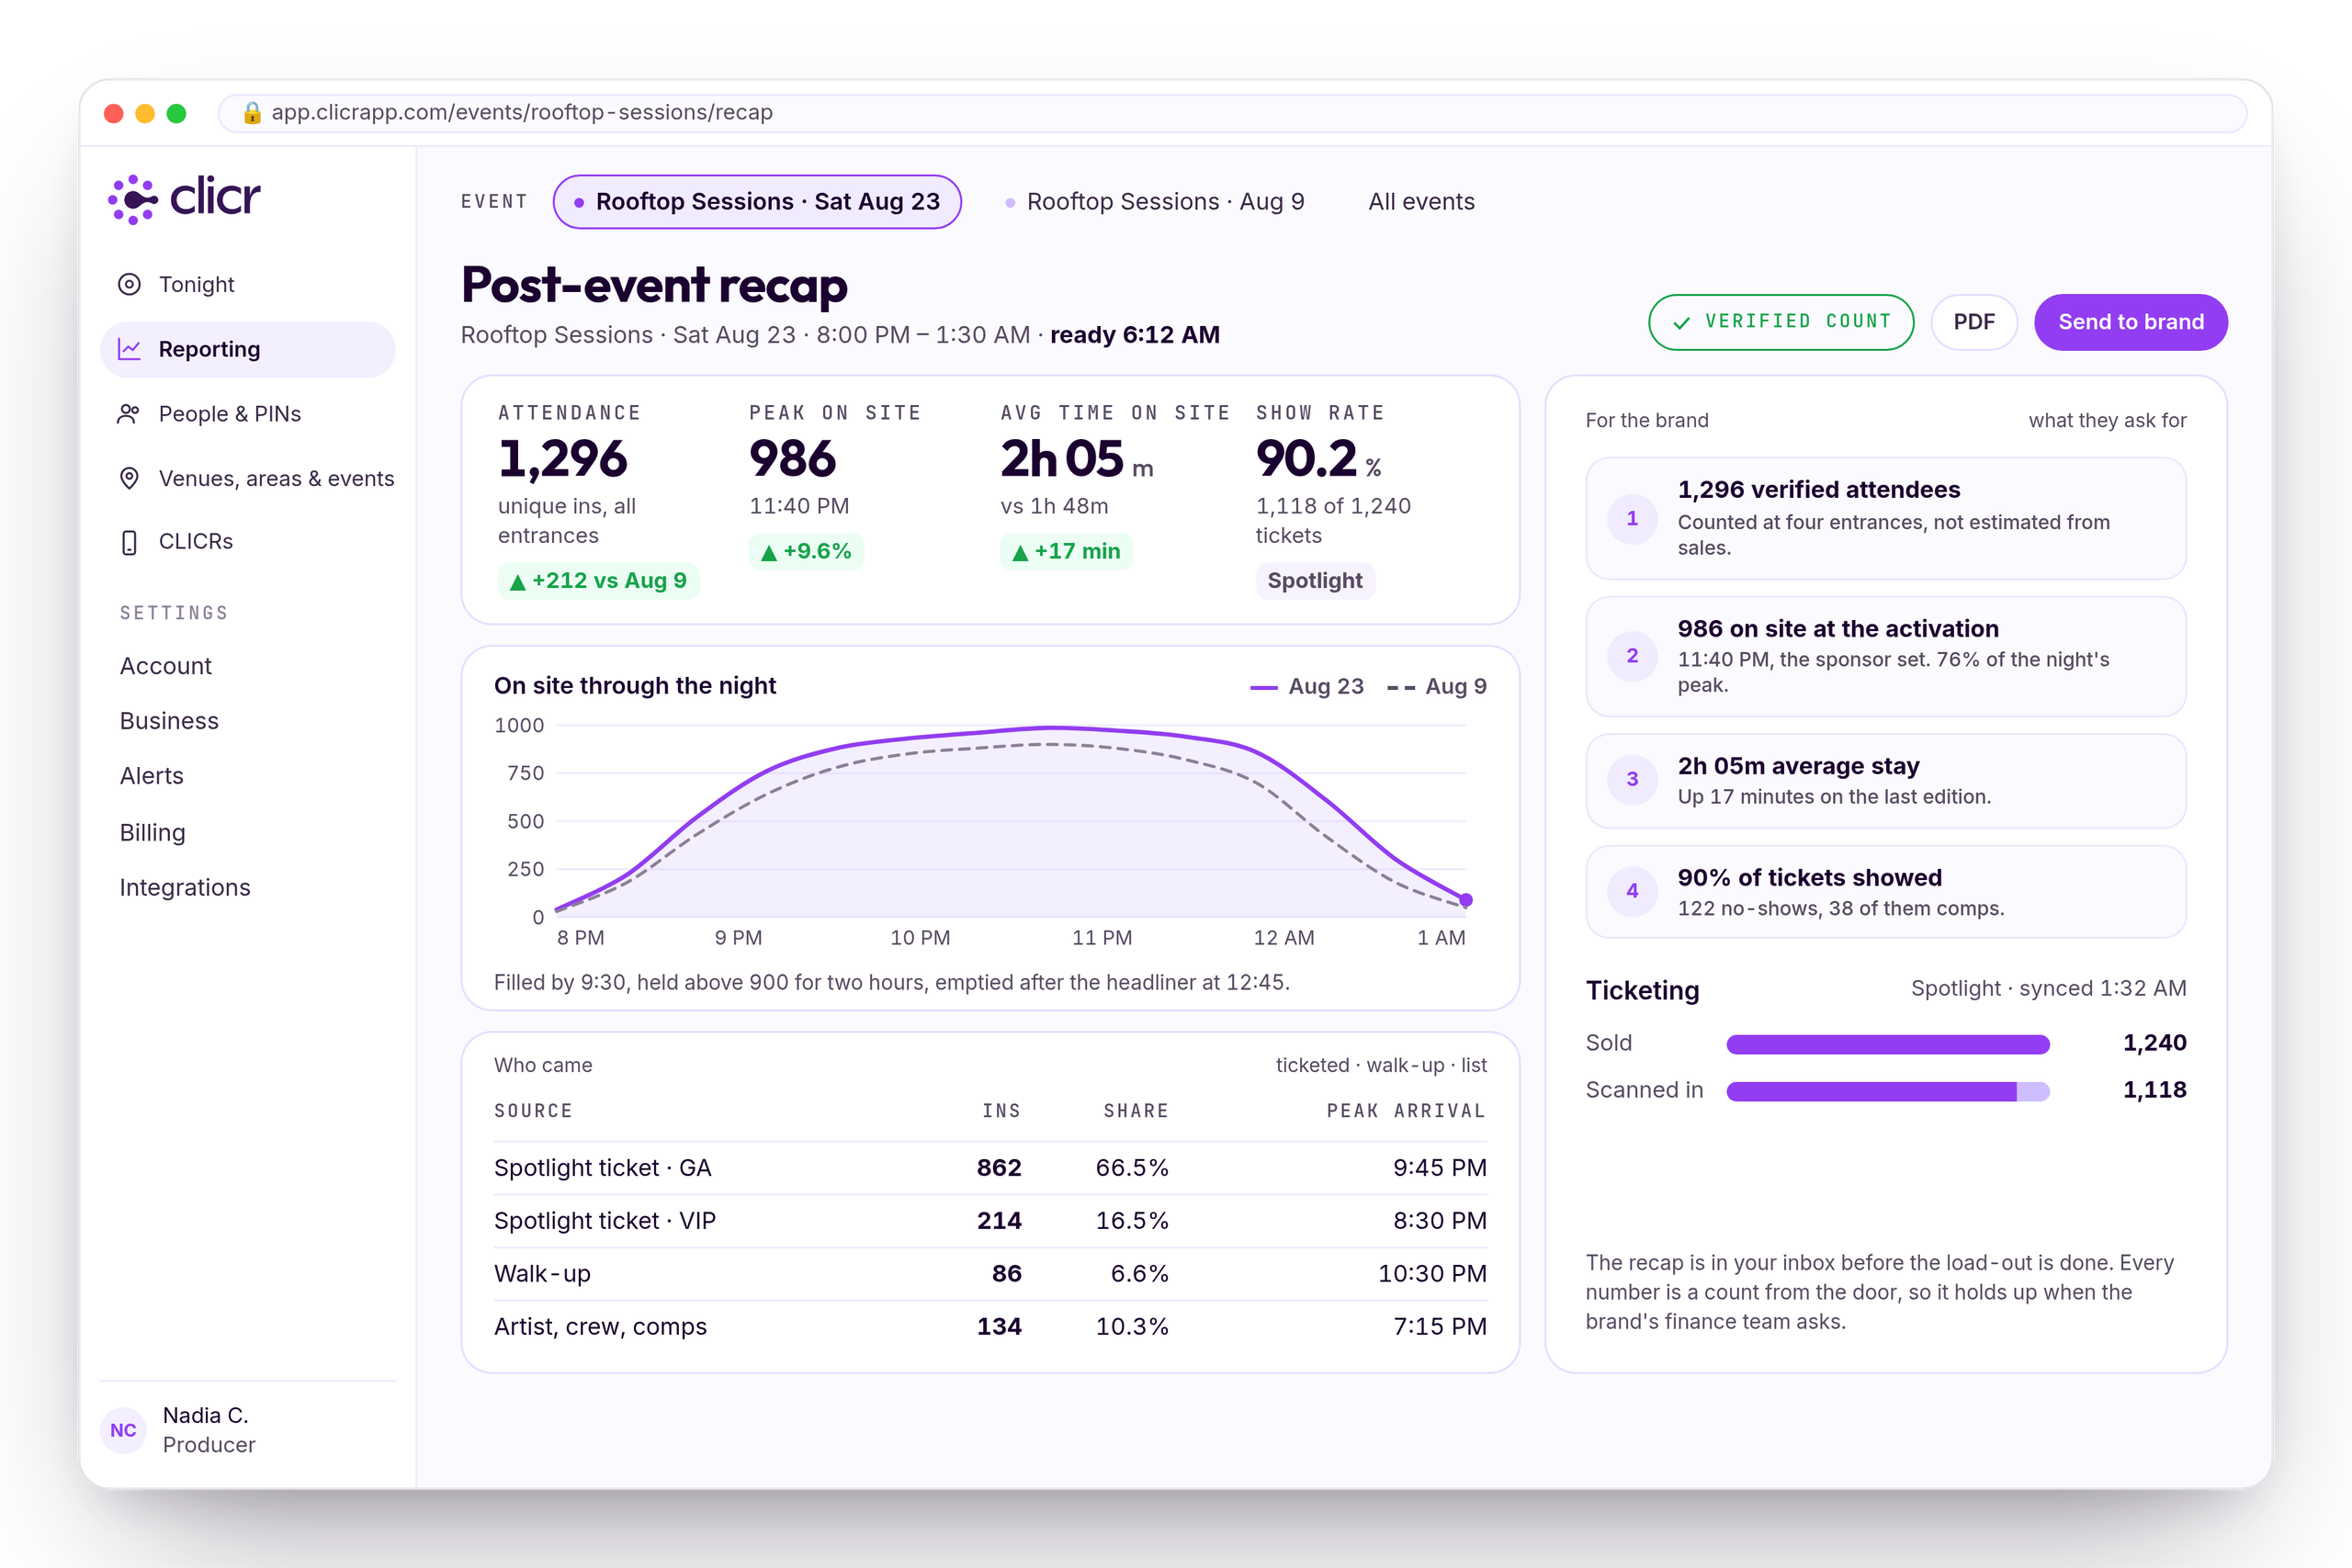
Verified attendance, peak on site, average stay, show rate against Spotlight, and the arrivals curve against the last edition of the same event. One click sends the PDF to the brand, and every number in it is a count from the door, not an estimate from sales.
Verified count
Counted at four entrances and reconciled against Spotlight. It holds up when the brand's finance team asks.
Against last time
Same event, previous edition, same chart. Up 212 and 17 minutes of stay.
Send to brand
PDF, one click, before anyone has slept.
Whatever you’re running, the rest is the same.



Logos represent pilots, partnerships, or active user testing.
“I can show the CEO the hard data on how the event did.”
Run one night on it.
That’s the pitch.
No commitment. We set you up for your next event. You run it, you see the numbers.