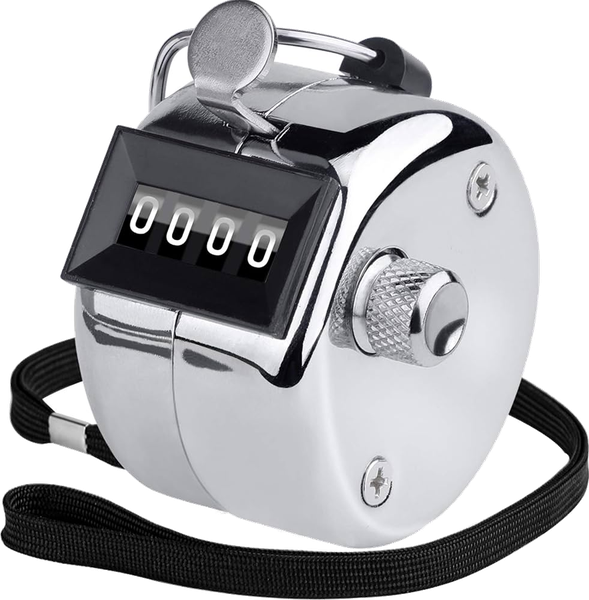
You count the door.
You own what it tells you.
Total visits, dwell time, busy hours, and what crowd is walking in, from one simple count.
Your mail app should be opening. If nothing happened, it is not set up on this device — use one of these instead.
hello@clicrapp.com
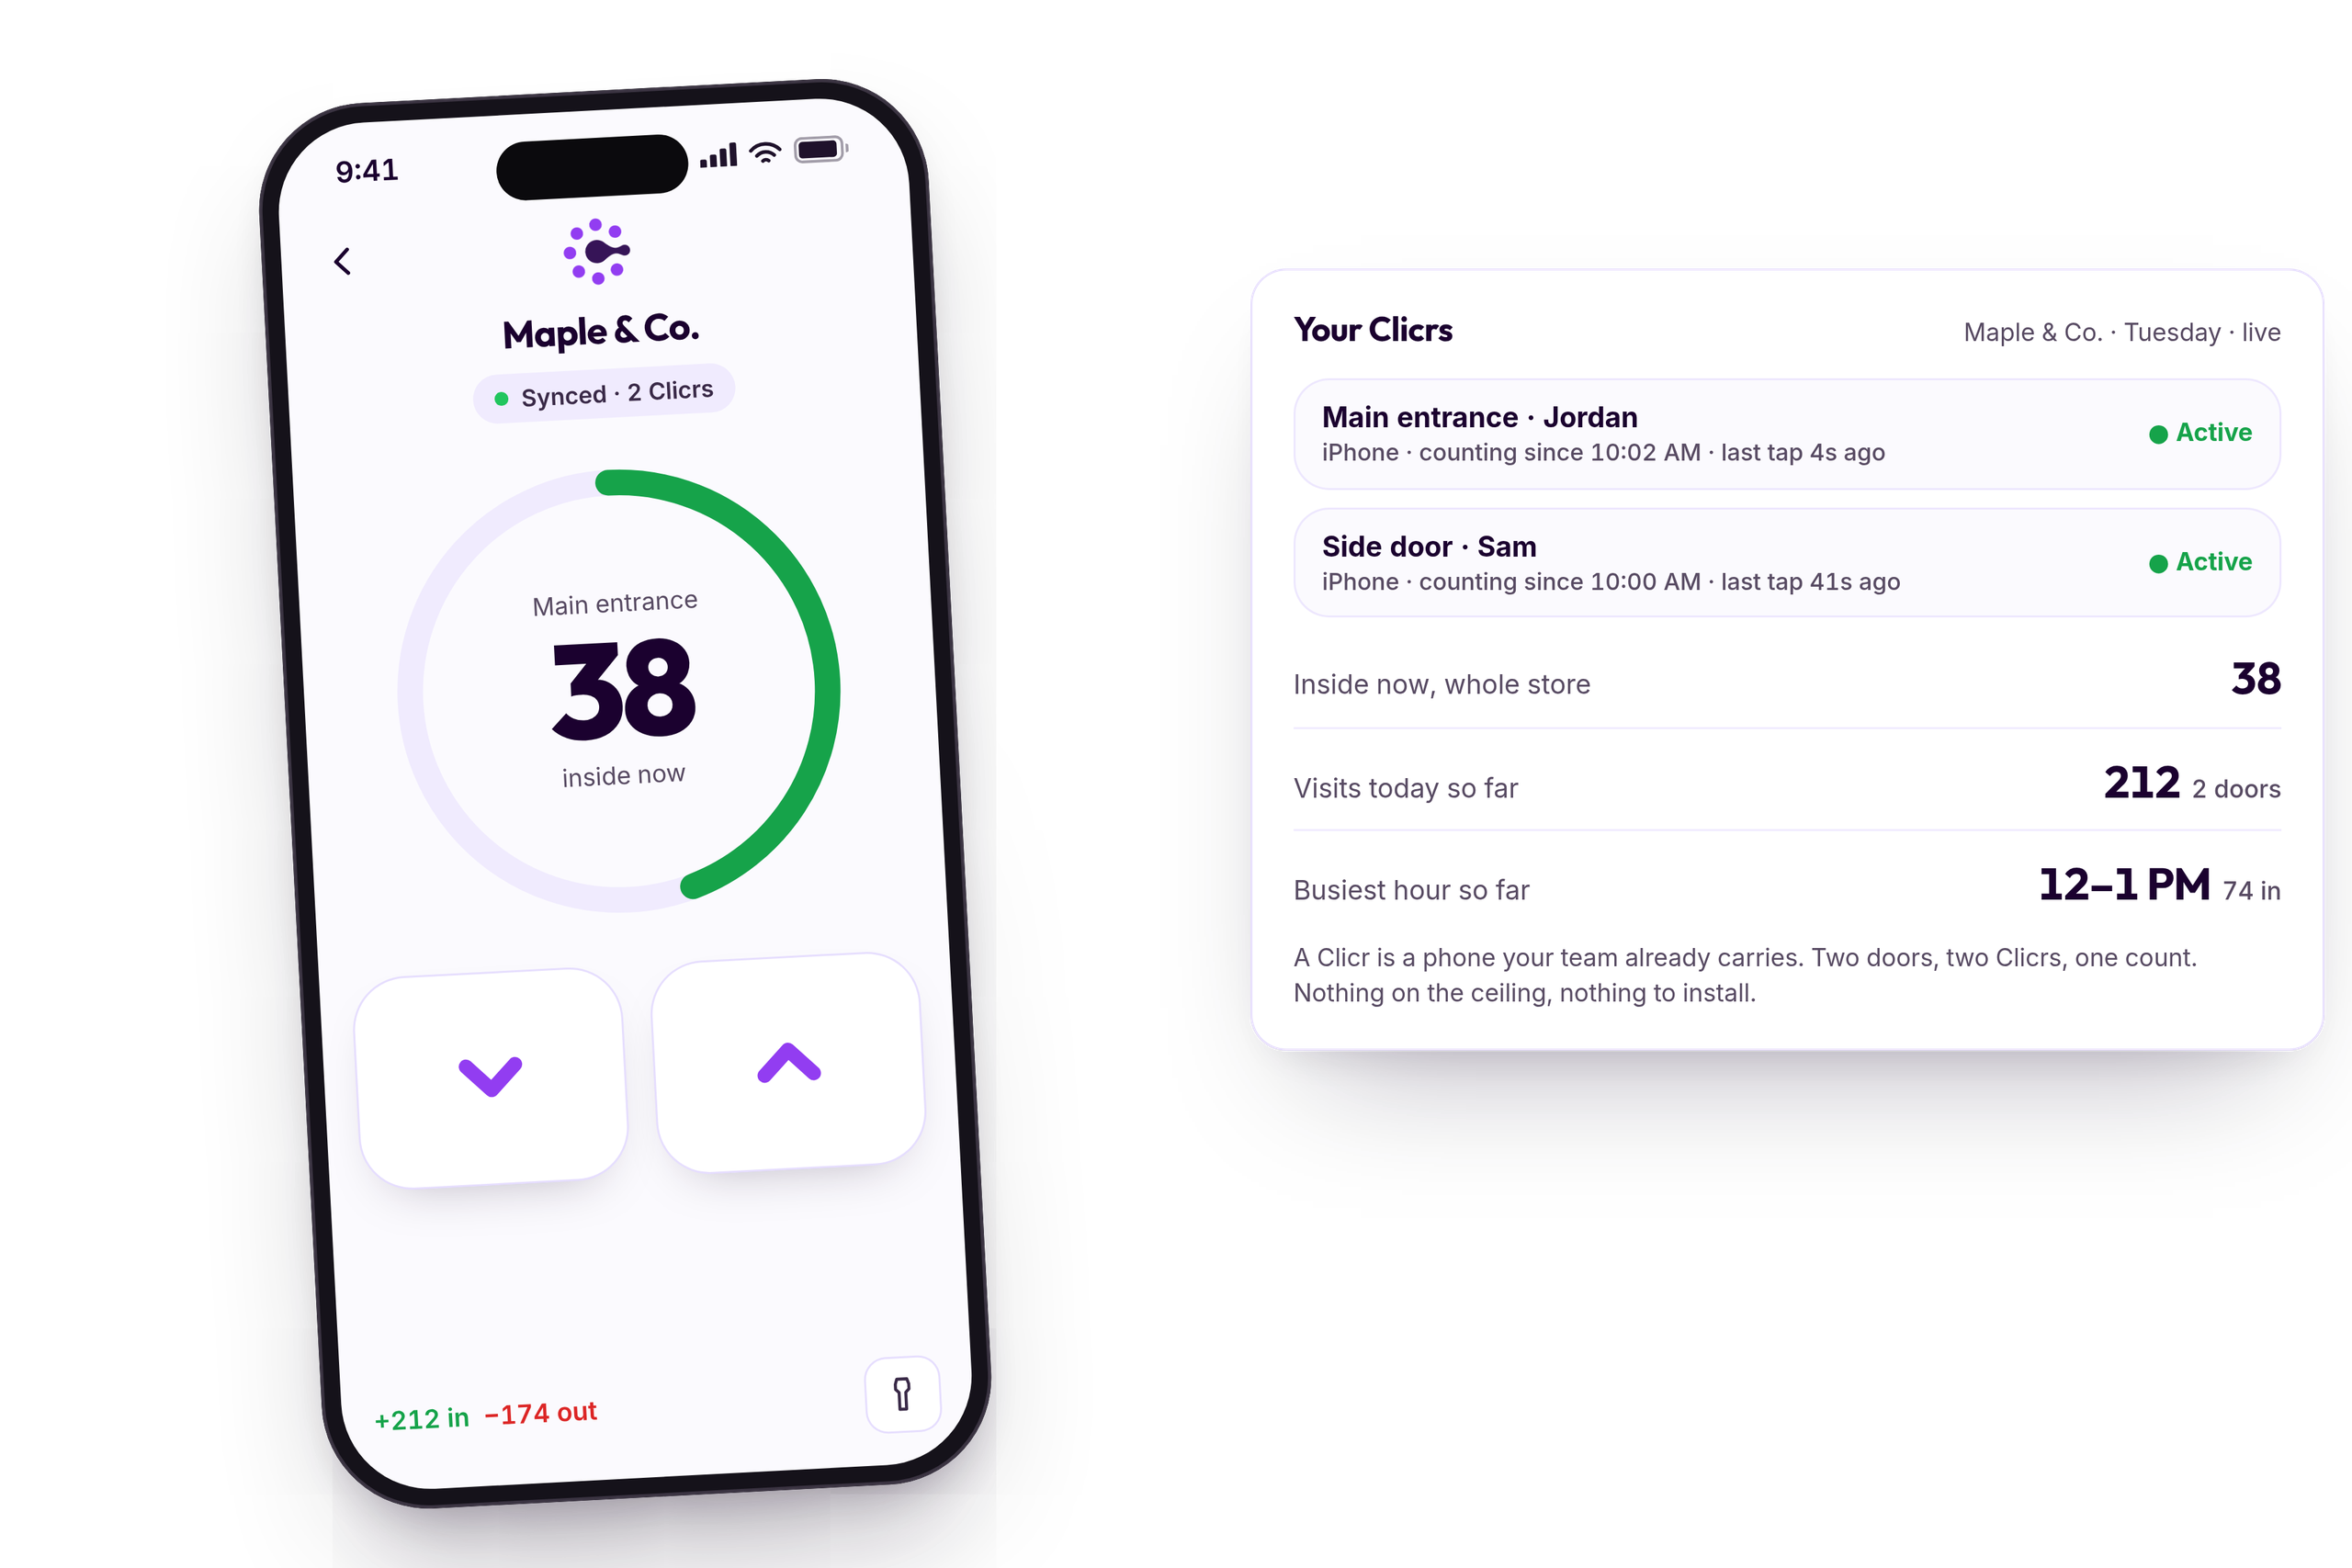
A phone is the sensor
A Clicr is CLICR on a phone your team already carries. Add one to a door in a minute.
Who is counting
Each Clicr shows the staffer on it and their last tap, so a quiet door is a question, not a mystery.
No hardware
No sensors, no installer, no maintenance contract. Two doors is two phones.
You don’t know your real traffic.
You’re guessing.
How many came in? When were you busiest? What crowd is walking through? Most stores are guessing, or paying thousands for a sensor system.
Real foot traffic
Every visit counted, not estimated.
Dwell time
How long the store holds them.
Your busiest hours
Staff to the rush, not the guess.
What crowd walks in
Visitor split, live.
Today,
as it happens.
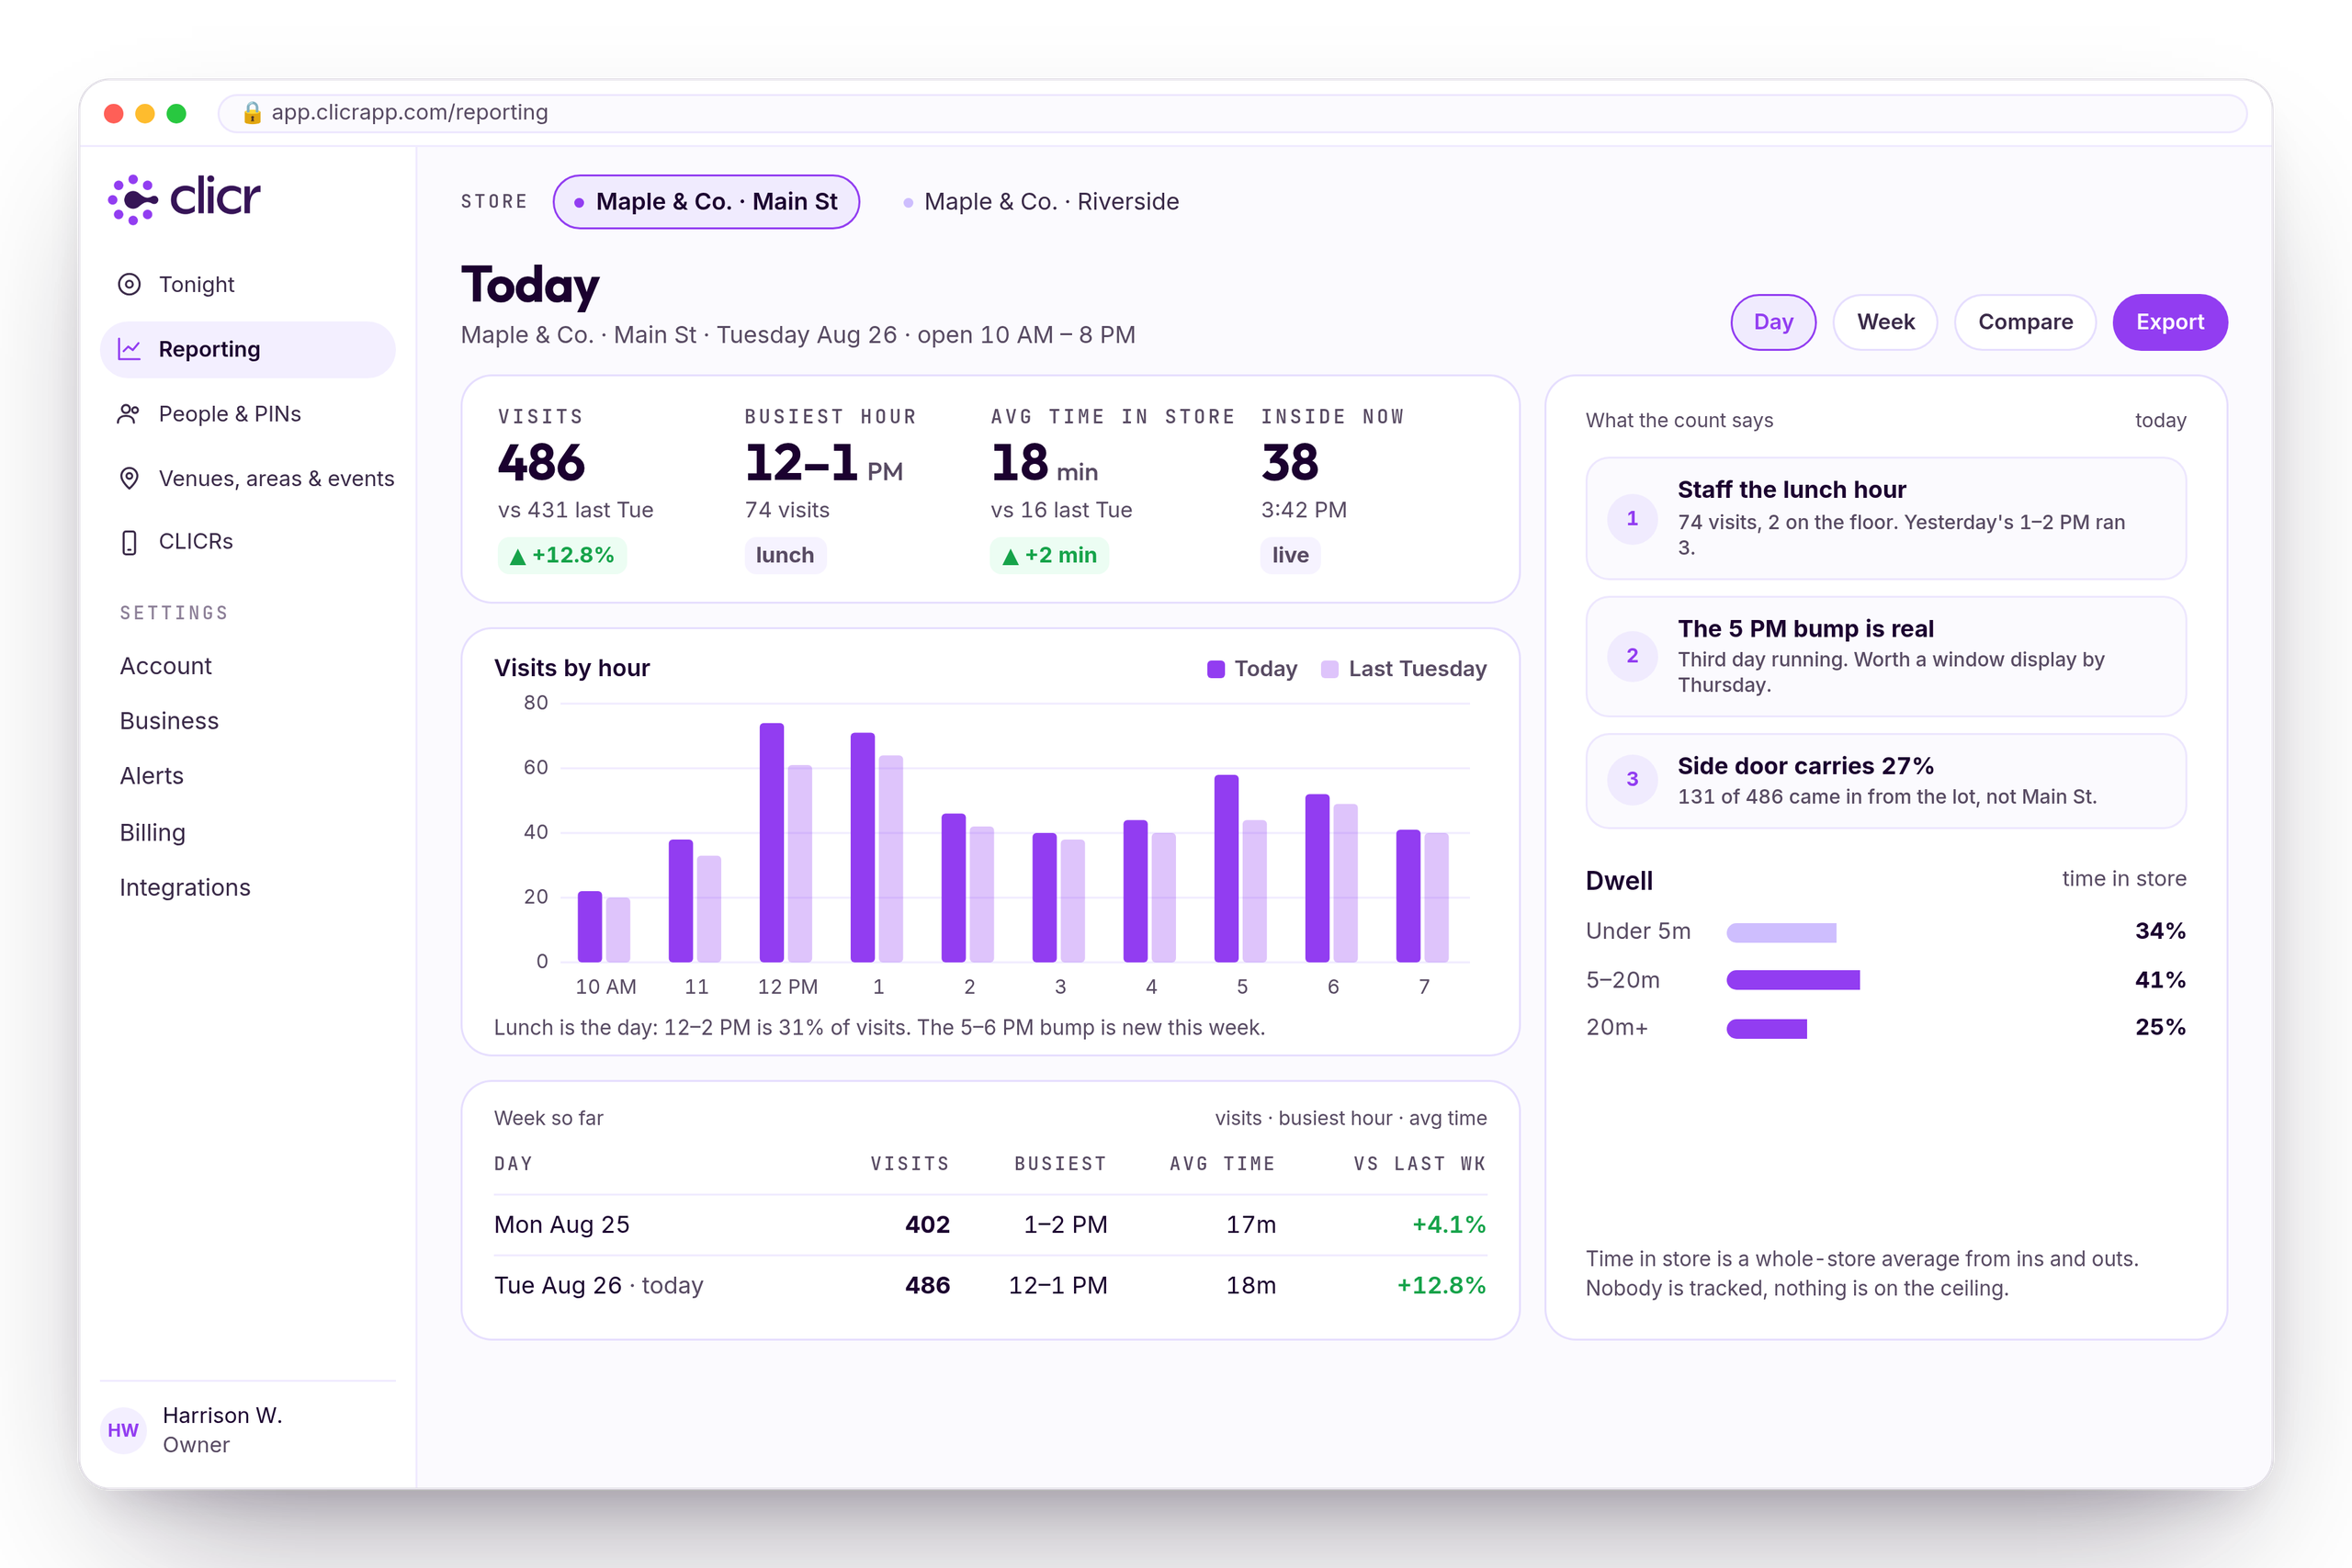
Visits, busiest hour, average time in store and who is inside now, against the same day last week. Then the three things the count is telling you, written out, so the number turns into a decision before lunch.
Visits by hour
Staff the lunch hour, not the whole day. Yesterday's 1–2 PM ran three on the floor; today's ran two.
Time in store
A whole-store average from ins and outs. Nobody is tracked, nothing is on the ceiling.
By door
Which entrance carries the traffic. The side door from the lot brought 27% of today.
This week
against last.
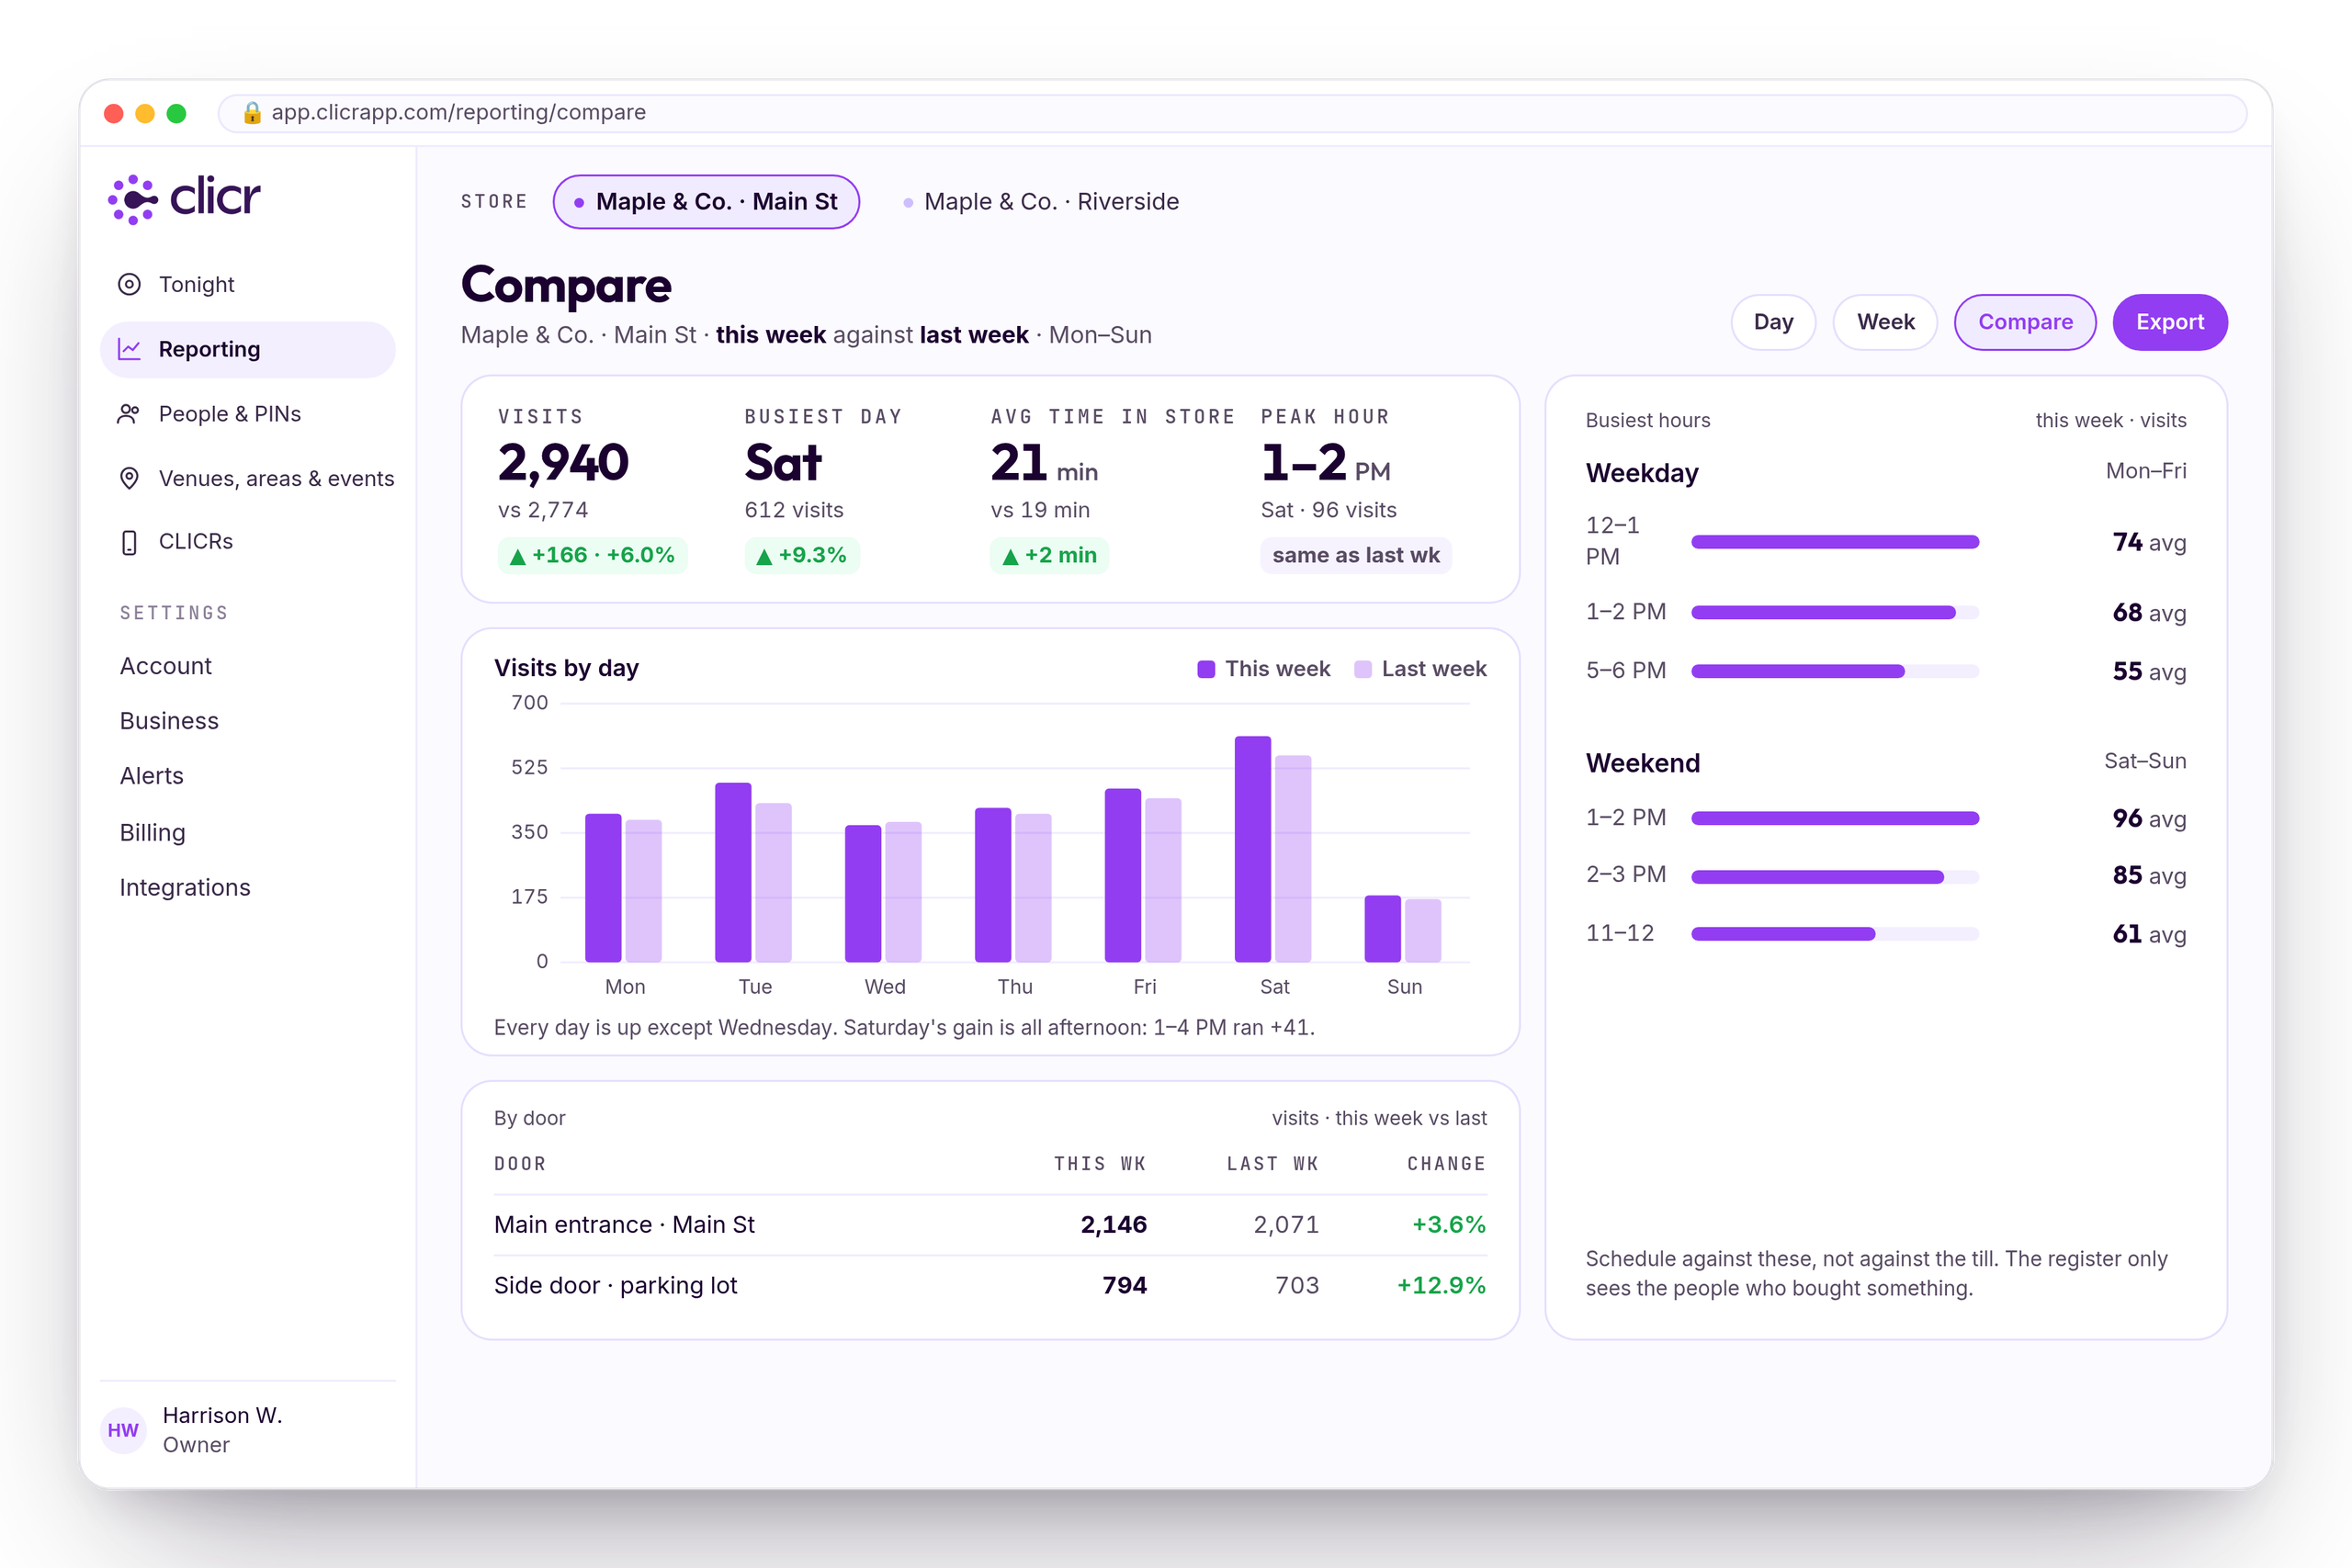
Every day side by side, the busiest hours for weekdays and the weekend, and each door's share of the week. Schedule against these, not against the till: the register only sees the people who bought something.
Week over week
Up or down, by day, in one glance. Every day up except Wednesday.
Busiest hours
Weekday and weekend separately, because they are different stores.
Exports
CSV and PDF for the landlord, the buyer, or the schedule. On Insights and Verify.
Whatever you’re running, the rest is the same.





Logos represent pilots, partnerships, or active user testing.
The foot-traffic analytics stores pay $12K a year for.
The core of it, from a Clicr.
Give it a week.
That’s the pitch.
No commitment. We set you up in your store, you run it a week, you see the traffic.